
From there on the market moved sideways into the last hour of trading. We went into the last 20 minutes of the session when markets seemed to stage a rally. The midday high got broken in the last couple of minutes of the week!
5m-chart SPY (white line between 126.15 and 126.20 is the resistance-trendline - see daily chart):

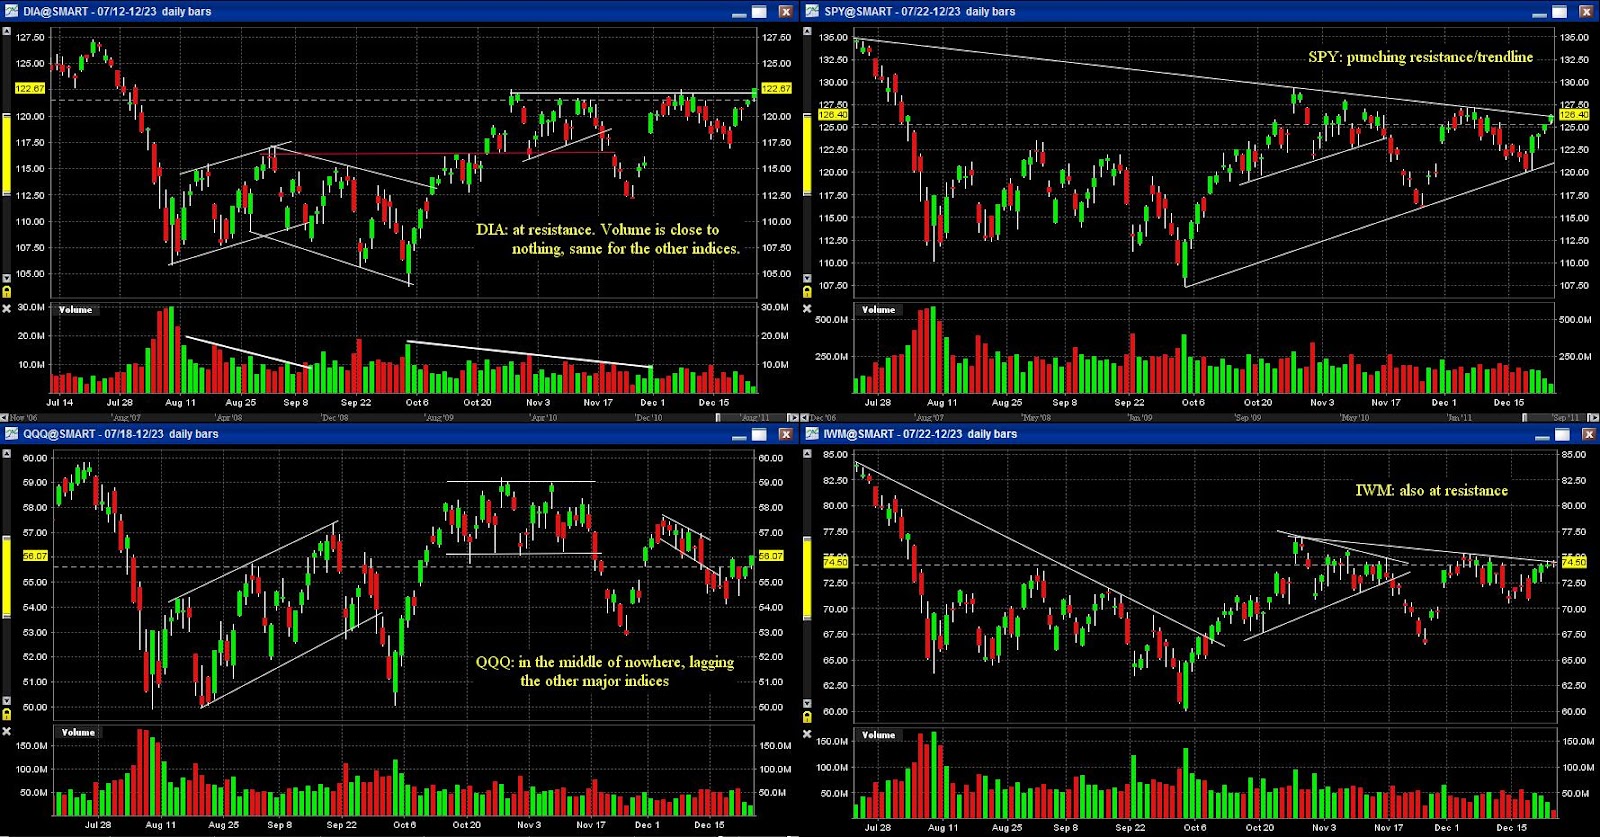
Daily charts DIA, SPY, QQQ and IWM:
Where gold, silver, oil and the euro all traded near breakeven, copper rallied higher +1%. Copper was seen as a market leader during most of the 2009-2010 bull market. From September 2011 on, that correlation seemed to have gone and copper underperformed stocks. However, this week it's back up together with stocks, where as gold and silver are more or less trading sideways. The question is, is this renewed correlation between copper and stocks a positive sign (mainly for stocks?), or is all this just due to holiday trading?
All in all a positive week for the indices, with stocks rallying nicely, but on low (holiday) volume. With many indices so close to or at resistance, everything is possible from here on.
Maybe next week Santa will show us what he's got.

Please, no Santa, not like that!
A few articles to read, in case you don't know what to do this weekend (or on Monday, when markets will be closed):
S&P on Europe: Still Hopeless
Santa Rally or Grinch in Disguise
Ramblings of a Dad and Tape Reader
The American Dream
MERRY CHRISTMAS!!
No comments:
Post a Comment