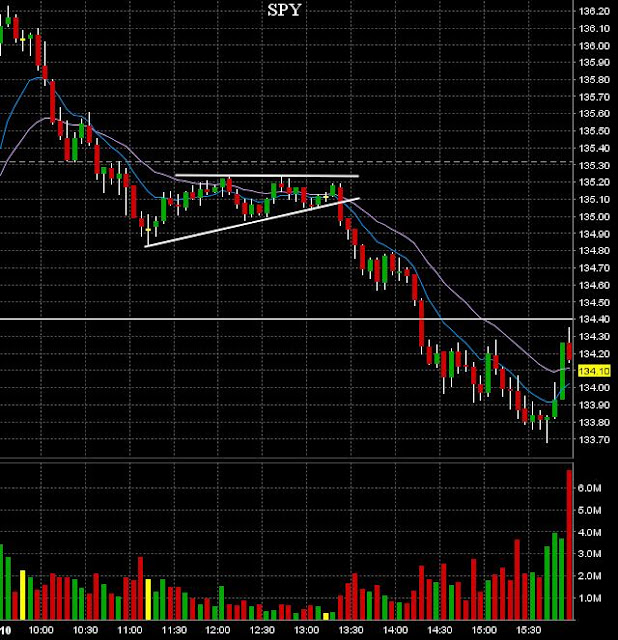
The market opened with a nice gap up, which was sold soon after the opening.
Yesterday's support held, but the fact that price started to build a triangle just above, wasn't a good sign. And indeed, in the afternoon the triangle broke to the downside and we lost about 1%.
Barely a bounce into the close and the result is that daily charts are printing ugly bearish engulfing candlesticks on the major indices.
5m-chart SPY:
Daily charts DIA, SPY, QQQ and IWM:
Euro, oil, metals
The euro was less weak than indices, metals and oil, and 'only' down half a percent.
Oil and metals on the other hand got a beating, especially silver and oil (both down 2% or more).


No comments:
Post a Comment