We opened with a big gap up that got faded at the open. We even undercut yesterday's low. A small bounce brought us back near those lows and just when it seemed that the market would turn down again, the reversal came. And what a reversal it was! After news came out that China would invest in the euro bailout fund (EFSF), we went about 1% higher in no time, bringing us back to the morning highs.
5m-chart SPY hereunder. Brake lower of the yellow trendline wasn't that successfull. Brake higher of the white trendline however...
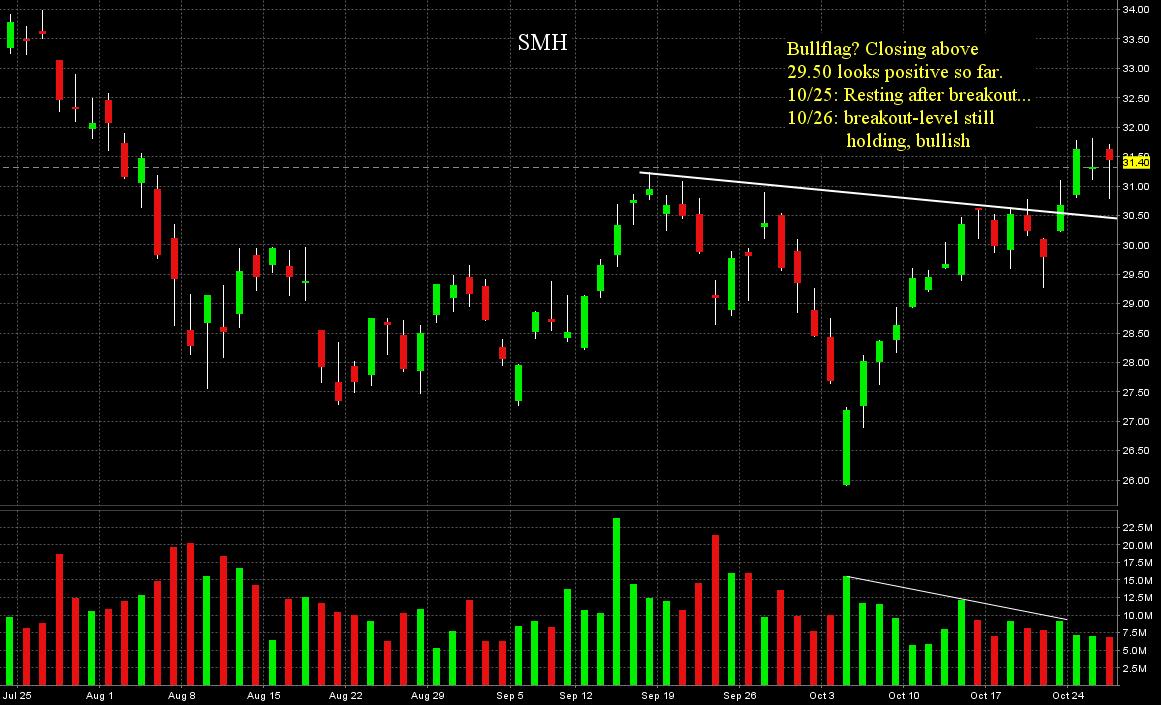
Daily charts DIA, QQQ and SMH:
Gold and silver went moderately higher, while oil was one of the losers today. Copper gave back some of it's morning gains, but it's still up nicely. The euro of course rebounded on the China-bailout news.
Trades
My TZA-position opened yesterday, hit it's stop in premarket (see here).
The second hour of the session showed lots of strength in most inverse ETF's (big strong closing candles on good volume), so I waited for a pullback and opened small/half positions in TZA, FZA, SPXU, BGZ, EDZ and SKF. However, the news that China would invest in EFSF, made my stops pop one by one, except for EDZ and SKF. Those 2 followed a little later, so back to 100% cash.
TZA: long 34.86, out 33.90 (-2.75%)
FAZ: long 45.23, out 43.97 (-2.79%)
SPXU: long 15.45, out 14.99 (-2.98%)
BGZ: long 34.67, out 33.57 (-3.17%)
SKF: long 66.30, out 64.90 (-2.11%)
EDZ: long 21.04, out 20.28 (-3.61%)
No need in trying to trade longer-term, if even hourly charts don't work... Daytrading it is, I will settle for 5 minute SPY-charts from now on... untill this thing clears...
Here's how Barry Ritholtz sees the current trading environment.
Showing posts with label SKF. Show all posts
Wednesday, October 26, 2011
Tuesday, October 18, 2011
10/18 - Intraday update
This morning was a good one for financials. Although GS reported a big loss, BAC saved the day, reporting a $6.2 billion profit. That seemed to lift the market, together with good economic data (see below).
More to come after the market close.
Trades
I took some profits in BGZ yesterday after-hours and other today in pre-market: FAZ, SKF, EDZ. All 1/3 position, just like TZA yesterday. When the indices started rising in the first hour of the session, I got stopped out of FAZ, SKF, BGZ and TZA (all stops were raised, some over breakeven), all for small or mediocre gains.
Results of the jury:
SKF: +0.56%
FAZ: +0.92%
BGZ: +2.04%
TZA: +2.49%
Still in EDZ, it survived the opening...
Looking to reposition in these ETF's should we go lower later this week.
More to come after the market close.
Trades
I took some profits in BGZ yesterday after-hours and other today in pre-market: FAZ, SKF, EDZ. All 1/3 position, just like TZA yesterday. When the indices started rising in the first hour of the session, I got stopped out of FAZ, SKF, BGZ and TZA (all stops were raised, some over breakeven), all for small or mediocre gains.
Results of the jury:
SKF: +0.56%
FAZ: +0.92%
BGZ: +2.04%
TZA: +2.49%
Still in EDZ, it survived the opening...
Looking to reposition in these ETF's should we go lower later this week.
Monday, October 17, 2011
Bears finally win one
Today started with a premarket rally to 1230 in S&P-futures. That was the turning point, indices started grinding their way lower. No panic selling, but a slow and steady ride south. 6 hours and almost 30 points later (/lower), first big support came in near 1203. We bounced, only to go through the level an hour later.
Next up was 1195 where price bounced again, an hour before the end of the session. That number coincided with 120 in SPY, both held perfectly. Bears still tried to get new lows in the last half hour, but bulls defended the spot well at first. A big fight followed between the 120 and the 120.70 level (for SPY). But in the end, the bears won with a close near the lows. SPY 5m-chart:
Daily charts for DIA, QQQ and SMH:
Trades
After a few triggerhappy early attempts last week, I got in TZA again. This time only after it broke a trendline on the hourly chart. Volume could have been better, but other inverse ETF's looked similar attractive in set-up so I went long. I also bought some other ETF's, an overview:
TZA: long 37.94, SL37.23 and sold 1/3 at 39.00 (moved SL up @37.75)
BGZ: long 36.76, SL35.90
EDZ: long 23.62, SL22.70
SKF: long 74.88, SL73.04
FAZ: long 54.68, SL52.66
All ETF's closed near their highs on good volume, so expecting at least some follow-through tomorrow.
Monday, September 12, 2011
More trouble from the Eurozone
Still a lot to do about the Eurozone-troubles and futures opened 1.5% lower. And while Obama is trying to get his job plans approved, Bank of America will cut 30,000 jobs. Ouch, not helping!
An early morning rally got stopped near Friday's close-level. From there on we chopped lower, forming a wedge. This wedge got broken on rumors that China would help Italy. There was a lot of unclarity if the news was false or not, so stocks dived down and later on spiked again, resulting in a very strong rally into the close.
5m-chart SPY:
Tech was performing better than the rest, creating a divergence between Nasdaq on one hand and other major indices on the other hand. Oil was rallying, but gold and silver got hit bad. While almost everything moved in sync today, gold and silver didn't move up as much as stocks did in the afternoon rally.
Indices still closing inside the presumed bearflag, but we went outside of it intraday. So tomorrow will be key, will we reverse or add to today's strength?!
Daily chart DIA:
Trades
My inverse ETF's went well and 1/3 was sold in pre-market. The balance was closed together with the ES-futures early in the session, basically breakeven. But I went long more ES-futures 5 minutes in the session (strong open on a big gap down after two downdays) and sold half an hour later for +10 points.
SGG and BAL doing just fine, so keeping them in my portfolio.
The closed trades:
BGZ: +2.57%
EDZ: +3.72%
SKF: +1.78%
SPXU: +2.48%
FAZ: +2.81%
TZA: +1.88%
ES-futures: 'the hedge': -8.25 points, added morning trade: +10.75 points. All in all not a bad day!
An interesting article about volatility thru the years, spotted by The Reformed Broker, aka Joshua Brown.
An early morning rally got stopped near Friday's close-level. From there on we chopped lower, forming a wedge. This wedge got broken on rumors that China would help Italy. There was a lot of unclarity if the news was false or not, so stocks dived down and later on spiked again, resulting in a very strong rally into the close.
5m-chart SPY:
Tech was performing better than the rest, creating a divergence between Nasdaq on one hand and other major indices on the other hand. Oil was rallying, but gold and silver got hit bad. While almost everything moved in sync today, gold and silver didn't move up as much as stocks did in the afternoon rally.
Indices still closing inside the presumed bearflag, but we went outside of it intraday. So tomorrow will be key, will we reverse or add to today's strength?!
Daily chart DIA:
Trades
My inverse ETF's went well and 1/3 was sold in pre-market. The balance was closed together with the ES-futures early in the session, basically breakeven. But I went long more ES-futures 5 minutes in the session (strong open on a big gap down after two downdays) and sold half an hour later for +10 points.
SGG and BAL doing just fine, so keeping them in my portfolio.
The closed trades:
BGZ: +2.57%
EDZ: +3.72%
SKF: +1.78%
SPXU: +2.48%
FAZ: +2.81%
TZA: +1.88%
ES-futures: 'the hedge': -8.25 points, added morning trade: +10.75 points. All in all not a bad day!
An interesting article about volatility thru the years, spotted by The Reformed Broker, aka Joshua Brown.
Friday, September 9, 2011
Another gap and a trend down day
A rather strange day with stocks as well as gold (minimal), silver and oil declining. So were did the money go then? Well, the dollar keeps on rallying, also meaning the euro really gets hammered lately. Since the last trading day of August, the euro lost about 5%.
We had a trend day down, closing not too far from the low of day and near the bottom of the assumed bearflag. Indices went 2%-3% lower, mostly on Eurozone news and rumors of Greece defaulting. Let's see what the weekend has in store for us.
Trades
I went long the inverse ETF's I was stopped out earlier this week. I got a new buy signal this afternoon while the market was tanking.
BGZ: long 44.42 SL42.00
EDZ: long 23.98 SL22.70
SKF: long 80.45 SL76.70
SPXU: long 19.88 SL18.85
TZA: long 48.61 SL45.45
FAZ: long 63.03 SL58.80
I also bought ES-futures as a hedge against the inverse ETF's, probably just for the weekend.
I was stopped out of the last half of MCP at breakeven (55.51). Still in BAL and SGG, they're still looking ok.
We had a trend day down, closing not too far from the low of day and near the bottom of the assumed bearflag. Indices went 2%-3% lower, mostly on Eurozone news and rumors of Greece defaulting. Let's see what the weekend has in store for us.
Trades
I went long the inverse ETF's I was stopped out earlier this week. I got a new buy signal this afternoon while the market was tanking.
BGZ: long 44.42 SL42.00
EDZ: long 23.98 SL22.70
SKF: long 80.45 SL76.70
SPXU: long 19.88 SL18.85
TZA: long 48.61 SL45.45
FAZ: long 63.03 SL58.80
I also bought ES-futures as a hedge against the inverse ETF's, probably just for the weekend.
I was stopped out of the last half of MCP at breakeven (55.51). Still in BAL and SGG, they're still looking ok.
Wednesday, September 7, 2011
Trades update
I got stopped out of my positions in pre-market/overnight:
TZA: out 46.40 (average gain: 10.41%)
FAZ: out 59.50 (average gain: 9.75%)
SKF: out 77.00 (average gain: 6.38%)
BGZ: out 42.21 (average gain: 7.18%)
EDZ: out 21.39 (average gain: 2.72%)
Now let's see if the rally can hold and if volume comes in or not. If not, I will be looking to buy back some of these inverse ETF's. The Friday-morning gap will be crucial.
TZA: out 46.40 (average gain: 10.41%)
FAZ: out 59.50 (average gain: 9.75%)
SKF: out 77.00 (average gain: 6.38%)
BGZ: out 42.21 (average gain: 7.18%)
EDZ: out 21.39 (average gain: 2.72%)
Now let's see if the rally can hold and if volume comes in or not. If not, I will be looking to buy back some of these inverse ETF's. The Friday-morning gap will be crucial.
Tuesday, September 6, 2011
High volatility, bearflag not broken yet
US-markets were closed due to Labor Day, but in Europe the action carried on. With lots of bad news out in the Eurozone, and US-data not that great either on Friday, futures travelled a lot lower between Sunday evening and Tuesday morning.
The indices came off the pre-market lows and spiked on the ISM-numbers, only to reverse at the opening level. The bounce brought us above the morning high and over pre-market highs, even taking a shot at Friday's lows.
Translated to the S&P-futures that gives: up 15 points, down 15 points and up 27 again... (see 5m ES-futures chart above) Volatile enough for ya? The big gap nearly closed and for now the lower trendline of the assumed bearflag, still holds (see depicted daily chart of DIA below).
Gold gapped higher but a strong intraday reversal followed. A double top is possible on the daily chart. Silver was acting much weaker than gold while oil moved almost parallel with the market for most of the time.
EUR/USD at 1.40 now, the dollar is moving strong in the last 4 sessions. The euro finally gets punished after all the bad news from the eurozone lately, even despite a sharp spike up on the CHF-news.
Trades
Despite being down quite some intraday, the inverse ETF's in my portfolio still ended up between 1% and 5% in the green. I moved up my stops, still leaving enough room for a pullback. I sold half of EDZ at 2R. All trades are now half the starting size, i'm looking to add bigger size when price/action/volume seems right.
The indices came off the pre-market lows and spiked on the ISM-numbers, only to reverse at the opening level. The bounce brought us above the morning high and over pre-market highs, even taking a shot at Friday's lows.
Translated to the S&P-futures that gives: up 15 points, down 15 points and up 27 again... (see 5m ES-futures chart above) Volatile enough for ya? The big gap nearly closed and for now the lower trendline of the assumed bearflag, still holds (see depicted daily chart of DIA below).
Gold gapped higher but a strong intraday reversal followed. A double top is possible on the daily chart. Silver was acting much weaker than gold while oil moved almost parallel with the market for most of the time.
EUR/USD at 1.40 now, the dollar is moving strong in the last 4 sessions. The euro finally gets punished after all the bad news from the eurozone lately, even despite a sharp spike up on the CHF-news.
Trades
Despite being down quite some intraday, the inverse ETF's in my portfolio still ended up between 1% and 5% in the green. I moved up my stops, still leaving enough room for a pullback. I sold half of EDZ at 2R. All trades are now half the starting size, i'm looking to add bigger size when price/action/volume seems right.
Friday, September 2, 2011
Friday 09/02: Big gap and down we go
Earlier today I posted why the market was falling. Except for the bad jobs report, we were also running into resistance on several charts and market conditions were overbought.
The pattern we're seeing on the daily chart is a 4-day island reversal. It's actually Peter Brandt that pointed it out. And I have to agree with his post, this looks very bearish. If he's right, we still have a long way to go (down that is...)
As for today's action, market was rather rangebound thru out the first half of the session. Then we gradually started grinding lower. 118 on SPY (1175 on the ES-futures) was a support-level in the first two hours. In the afternoon the level got tested again and broke on very heavy volume! In the last half hour buyers were showing up but the previous support-level proved to be resistance now. Heavy volume selling in the last 5 minutes brought us back near the lows.
Trades
Yesterday's buys are nicely in the green (up between 7.3% and 12.4%) and I moved my stops in the money, still giving the ETF's enough room for a possible pullback (very likely after today's action). I took partial profits on all four of them (not letting the winners turn into losers).
Today I bougth EDZ @21.77 with SL @21.00 (also half position size like yesterday's buys).
Enjoy the long holiday weekend!
The pattern we're seeing on the daily chart is a 4-day island reversal. It's actually Peter Brandt that pointed it out. And I have to agree with his post, this looks very bearish. If he's right, we still have a long way to go (down that is...)
As for today's action, market was rather rangebound thru out the first half of the session. Then we gradually started grinding lower. 118 on SPY (1175 on the ES-futures) was a support-level in the first two hours. In the afternoon the level got tested again and broke on very heavy volume! In the last half hour buyers were showing up but the previous support-level proved to be resistance now. Heavy volume selling in the last 5 minutes brought us back near the lows.
Trades
Yesterday's buys are nicely in the green (up between 7.3% and 12.4%) and I moved my stops in the money, still giving the ETF's enough room for a possible pullback (very likely after today's action). I took partial profits on all four of them (not letting the winners turn into losers).
Today I bougth EDZ @21.77 with SL @21.00 (also half position size like yesterday's buys).
Enjoy the long holiday weekend!
Thursday, September 1, 2011
Market retreating after being overbought
With ISM-numbers coming out half an hour in the session, buyers turned up, sending the indices up about 1% under 5 minutes. A big spike up on big volume.
However, yesterday's highs proved to be solid resistance and after some chopping around, the market headed south slowly.
With indices closing near the lows, undercutting yesterday's lows and after yesterday's spinning tops, action looks very bearish. But then again, this was to be expected with the market being overbought (McLellan Oscillator was at 85 before today, over 50 is overbought).
Updated daily DIA-chart:
Gold and silver were trading in small ranges, printing inside days. Oil not doing much better. Tomorrow could be key, with nonfarm payrolls coming out and a 3-day weekend in front of us.
Trades
I bought some leveraged inverse ETF's halfway in the session. Only half position sizes, I will add when/if the market goes lower on volume or breaking a possible bear flag.
Long BGZ 39.55, SL 38.00
Long SKF 72.12, SL 70.00
Long TZA 42.63, SL 40.00
Long FAZ 53.83, SL 51.50
Width stops, giving these puppies some room to play... For now they're all green, but that can change quickly with these leveraged ETF's, hence the width stops and small position sizes.
However, yesterday's highs proved to be solid resistance and after some chopping around, the market headed south slowly.
With indices closing near the lows, undercutting yesterday's lows and after yesterday's spinning tops, action looks very bearish. But then again, this was to be expected with the market being overbought (McLellan Oscillator was at 85 before today, over 50 is overbought).
Updated daily DIA-chart:
Gold and silver were trading in small ranges, printing inside days. Oil not doing much better. Tomorrow could be key, with nonfarm payrolls coming out and a 3-day weekend in front of us.
Trades
I bought some leveraged inverse ETF's halfway in the session. Only half position sizes, I will add when/if the market goes lower on volume or breaking a possible bear flag.
Long BGZ 39.55, SL 38.00
Long SKF 72.12, SL 70.00
Long TZA 42.63, SL 40.00
Long FAZ 53.83, SL 51.50
Width stops, giving these puppies some room to play... For now they're all green, but that can change quickly with these leveraged ETF's, hence the width stops and small position sizes.
Subscribe to:
Posts (Atom)