Showing posts with label SNTS. Show all posts

Wednesday, April 4, 2012

Market Is Losing Steam, Oil And Metals Tank Hard

A big opening gap to the downside first consolidated some, but after half an hour into the session, indices started to go lower. Price kind of double bottomed intraday and in the afternoon a nice bounce/rally started. That got us back towards the opening levels in Dow and S&P500. Tech and small caps however were lagging and didn't bounce that much.

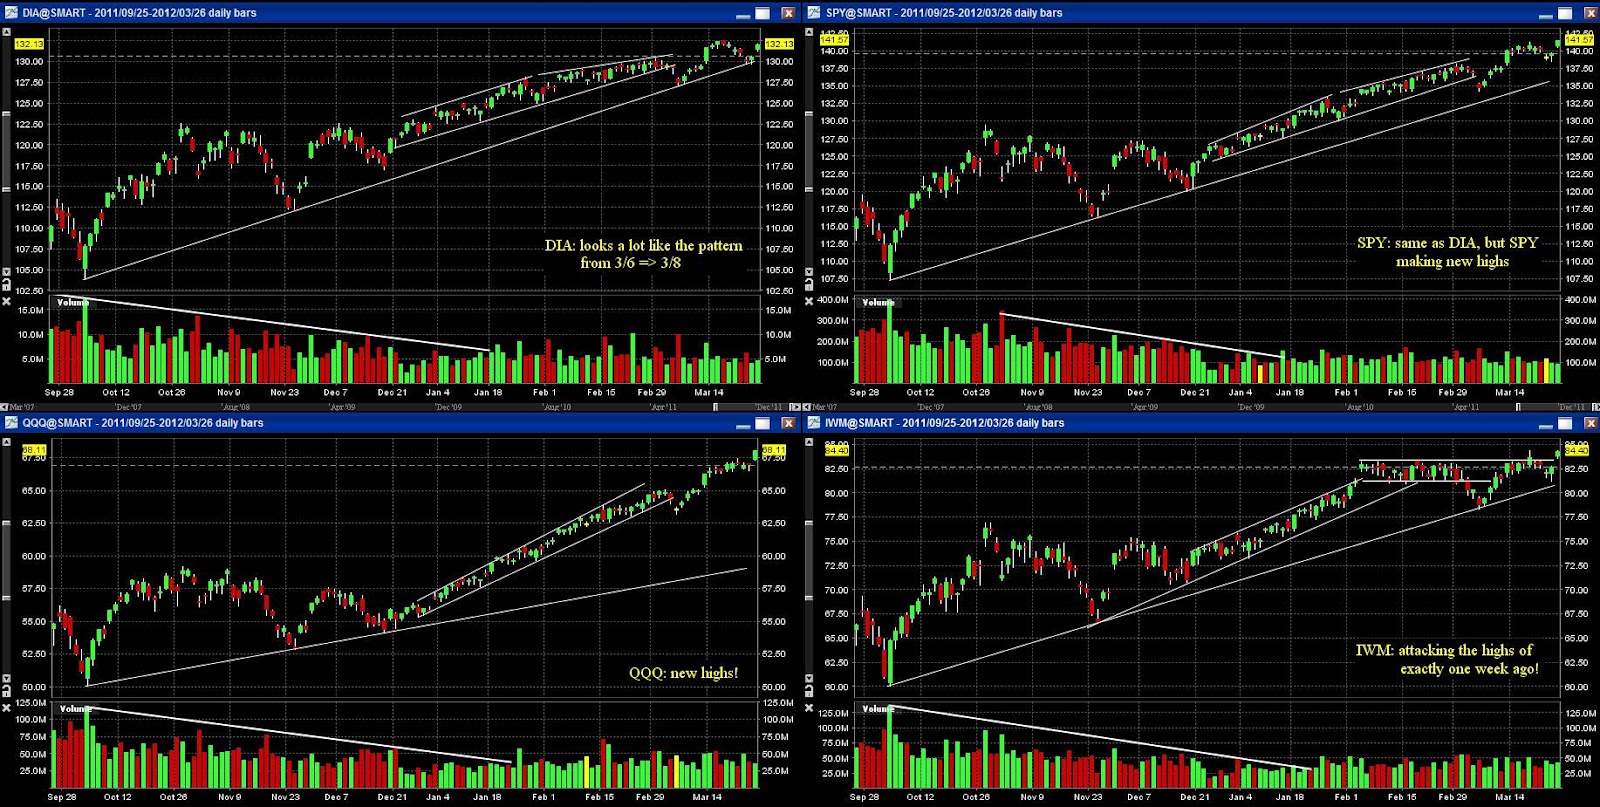
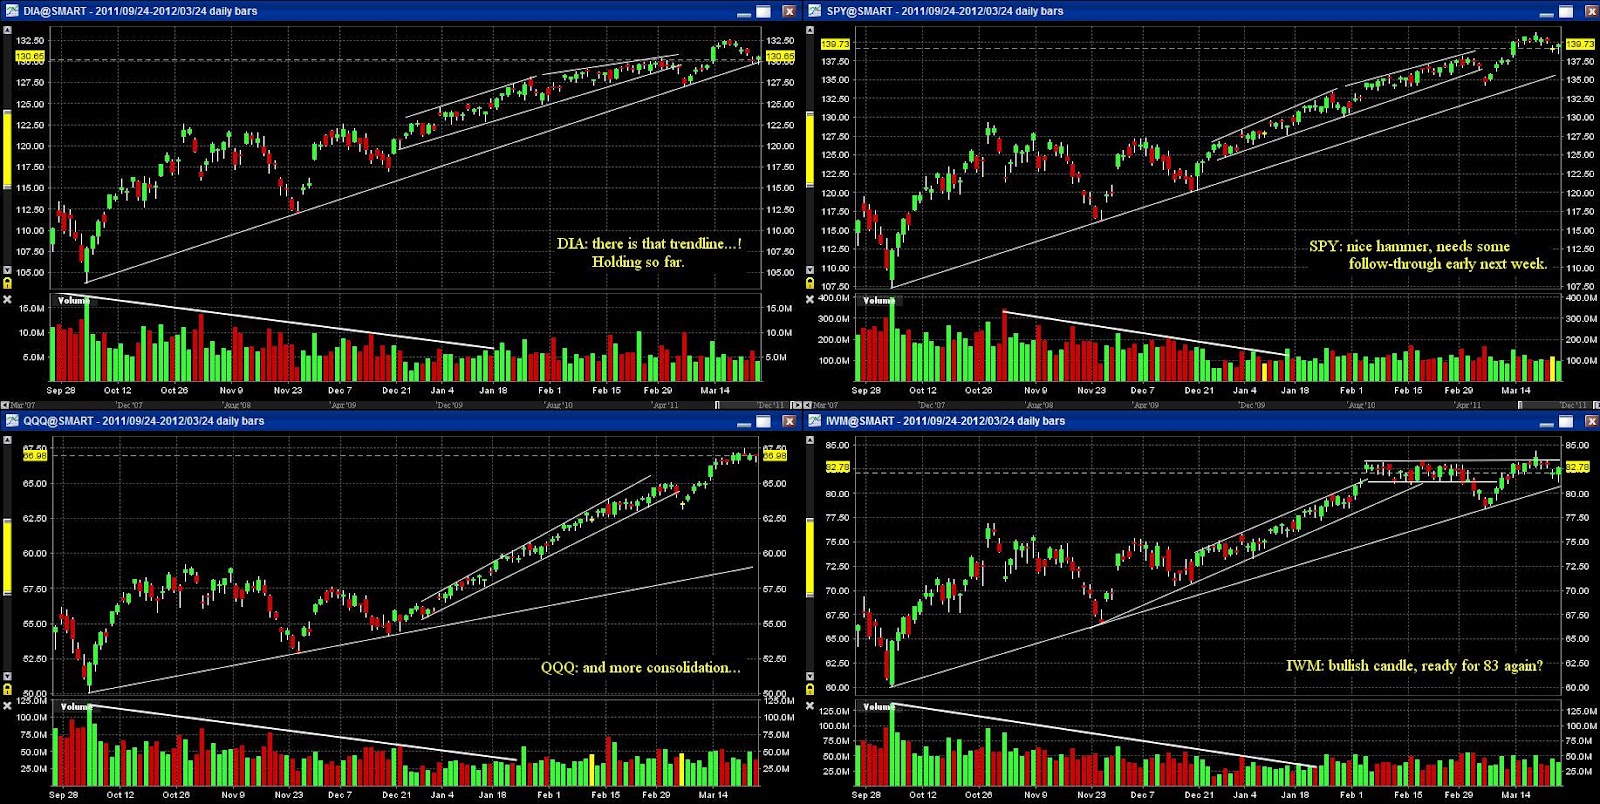
The daily charts are starting to show some cracks. There's the divergence in small caps, they are lagging for weeks now (+ failed break higher) and close to breaking the trendline. The Dow is now under it's trendline.
While tech bounced of it's trendline and 20-day moving average, small caps are having a hard time holding their 50-day moving average.

5m-chart SPY:


Daily charts DIA, SPY, QQQ and IWM:


Euro, oil, metals
Oil and metals sold off quite big today; oil -2%, silver even -4%!
The euro dropped some more after yesterday's ugly candle. We're back near 1.31.


Trades
All out of SNTS, my stop got hit at the start of the session. Average exit was 5.83 (in @5.51), for a gain of 5.53% (including commissions).

Tuesday, April 3, 2012

No QE3?

The indices were trading sloppy in the morning hours, with a slight downward bias. At 2 p.m., the FOMC Minutes were announced. Helicopter Ben implied there would be no more easing unless economic growth slows.

On that news, indices tanked 0.5% within a couple of minutes. With 90 minutes to go in the session, indices found a bottom and price even managed to get back to the levels from before the FOMC minutes.

5m-chart SPY:


Daily charts DIA, SPY, QQQ and IWM:


Euro, oil, metals
Especially the euro and metals lost big on the FOMC minutes. They barely recouped any losses, unlike stocks. Oil went down as well, but only moderate.


Trades
SNTS is holding my stop (5.80), still long although the candlestick on the daily is practically a bearish engulfing candle.

Monday, April 2, 2012

Another Rally, Keeping The Bulls Happy

Nothing special at the opening of the session. But after half an hour, volume came pouring in and that was the beginning of a nice and steep rally that ended at lunch time. From there on indices mostly went sideways with another failed break higher in the last 90 minutes of the session. That failed break was followed by a small sell-off, but nothing severe. All in all another good day for the bulls!

The Dow and S&P500 made new highs and tech is not too far behind. Small caps are still lagging and IWM seems to be stuck near that 83-level (see daily charts).

5m-chart SPY:


Daily charts DIA, SPY, QQQ and IWM:


Euro, oil, metals
A big move for oil today. First it went down to 102, the support-area from Thursday. Not only did that level held, the price of oil bounced off it and went all the way over 105 (+2%).
The euro is trading between 1.3275 and 1.3375, seems to be basing under the 1.34-level.
'Metals & mining' was the best moving sector, silver and copper were both gaining +2%, gold was lagging these two (+0.6%)


Trades
I sold another 10% in SNTS @5.98 (pre-market), now only holding the last 10%. SNTS had a nice break to new highs, still looking good.

Friday, March 30, 2012

Are The Bulls Getting Tired?


A gap higher got faded, not that surprisingly since momentum seems a bit lost the last 2 weeks or so. After 75 minutes of dropping lower, market started to climb again. The Dow and S&P500 got back up to opening levels, but tech and small caps lagged, no confirmation there.

The weekly charts of the indices don't look too hot. 2 consecutive (semi-)doji's for SPY and IWM plus fake break outs for IWM. QQQ prints 2 consecutive inverse hammers, each on lower volume. DIA on the other hand is lagging, but looks to be basing here, getting ready for a break higher. Since indices rather confirm than contradict each other in the long run, something has got to give here, sooner or later.

5m-chart SPY:


Daily charts DIA, SPY, QQQ and IWM:


Euro, oil, metals
All were up, but not by much. Copper was the biggest winner, adding almost 1%.


Trades
SNTS tried to break out to new highs, almost hitting 6. Holding this winner!


Have a great weekend everyone!

Thursday, March 29, 2012

Dipbuyers Doing Their Job

Indices gapped down and moved south early on in the session. We hit the bottom near lunch and started going back up in the afternoon. Back near yesterday's closing prices (Dow even above) after a nice afternoon of dipbuyers stepping up. Nice to see so many hammers in indices, bulls need to push some more tomorrow.

5m-chart SPY:


Daily charts DIA, SPY, QQQ and IWM:


Euro, oil, metals
After yesterday's underperformance, metals did pretty good today. The euro traded along with indices.
Oil however had a bad day, losing 2% and is moving lower out of the tight pattern from the last couple of weeks.


Trades
Still holding that last part of SNTS, came closing to being stopped out, but a nice recovery!

Wednesday, March 28, 2012

Another Downday But A Good Close

Another downday, the second in a row. No real harm done just yet, with volume so and so. But volume is not always a good indicator or the only thing to watch. What concerns me is that the Dow is making a lower high and the (second attempt) breakout in small caps has failed. These might be the first signs that a correction is coming soon.

I'm not going short here or saying to do so. But taking on new longs right now, is playing with fire imho. I'm certainly watching the trendline for the Dow (see daily charts) which is tested a few times the last couple of days. If this breaks, start looking for possible confirmation in other indices.

The good news is we had a strong close, so most indices closed up well from the lows. Bulls need to push some more tomorrow, to keep this rally going.

5m-chart SPY:


Daily charts DIA, SPY, QQQ and IWM:


Euro, oil, metals
Oil and metals got a beating today, the euro on the other hand traded near breakeven.


Trades
I sold another 20% of SNTS @5.81, stop-loss on remaining 20% is 5.62

I also tried some 'bottomfishing' in SPY today. Bought (on average) at 140.65 an sold 140.48.
The second try was barely better. After a quick sell-off on volume, I went long @139.87. I moved my stop just above BE on a spike higher to 140.20. Later on, I got stopped out @139.93.

Tuesday, March 27, 2012

Market Coming Off Its Highs Near The Close

After yesterday's rally, a consolidating day was the logical outcome for the indices. They mainly traded around yesterday's closing price. Except for tech that is. Nasdaq was the only major index in the green and it certainly had AAPL to thank for, which was up to new highs.

Some reason for concern is the selling (on rather high volume) we saw at the start of the last hour of the session. However, total daily volume wasn't high enough to call this a distribution day.

5m-chart SPY:


Daily charts DIA, SPY, QQQ and IWM:


Euro, oil, metals
They were all selling off at the open. Oil was the only one going back in the green/breakeven.
However, losses for metals and the euro were not that high.


Trades
Sold some more SNTS @5.86 (2/5 of position), holding on to the remaining 40%. Looking for 6 as the next target.

Monday, March 26, 2012

Gap Up And New Highs

Indices all gapped up but started to consolidate about an hour into the session. That took a few hours, but there was no deep pullback and price stayed above the opening range. In the afternoon a rally started that brought the major indices (except for the Dow) to new highs.

Very bullish action and this bull market seems far from over. But we're going up for 3 straight months now, this can't go one forever of course...

5m-chart SPY:


Daily charts, DIA, SPY, QQQ and IWM:


Euro, oil, metals
Metals had a good day, all up about 2%, doing better than indices.
The euro also performed well, breaking the 1.33-level. 1.35 next?
Oil is still trading within Friday's opening candle, but it's holding up well.

Trades
Holding on to my SNTS, sold 1/5 of the position per 5.74 (from entry 5.51)

Saturday, March 24, 2012

Another Dip Bought (Part 582)

Another morning dip, and again sellers were stepping in. What followed was a nice run throughout the day, back over yesterday's high. If we see some follow-through early next week, new highs are just around the corner.

5m-chart SPY:


Daily charts DIA, SPY, QQQ and IWM:


Euro, oil, metals
They all had a great day, especially metals and oil. Silver leading the pack. Oil spiked on news that Iran exports dropped 300k barrels a day in March.


Trades
I bought SNTS @5.51 (SL5.30) and NXPI @26.83 (SL26.00). I sold NXPI at the close (breakeven), not liking the total daily volume on it's breakout. SNTS however had great volume and looks like a runner. It does have some resistance right up ahead, I'll have to follow-up closely.